The five trends that defined the 2025-26 NHL season


The NHL’s 2025-26 regular season was a smashing success.
The standings were jammed all year. Big-name stars continued to dominate. A new wave of talent showed us a brilliant future. There were shocking shifts in the playoff field. Goals stayed north of six per game. And a thrilling Olympics was seamlessly wedged into a six-month sprint from October through April.
From a fan — and media — perspective, there was a lot to love about the league’s 109th season.
In the blink of an eye, the regular season calendar ends Thursday night and the Stanley Cup Playoffs launch on Saturday. It’s the perfect time to reflect on five major trends that defined the 2025-26 season. What made this season unique? And what can it tell us about the future of the NHL?
#1. Nearly every team was in the playoff race the entire season.
Commissioner Gary Bettman is regularly asked about the league’s wonky points system. When a team like the Los Angeles Kings qualifies for the playoffs with 22 regulation wins, questions inevitably get raised. But there’s a reason the commissioner has so adamantly defended the system’s obvious flaws this season: everyone, and I mean everyone, was in the playoff race.
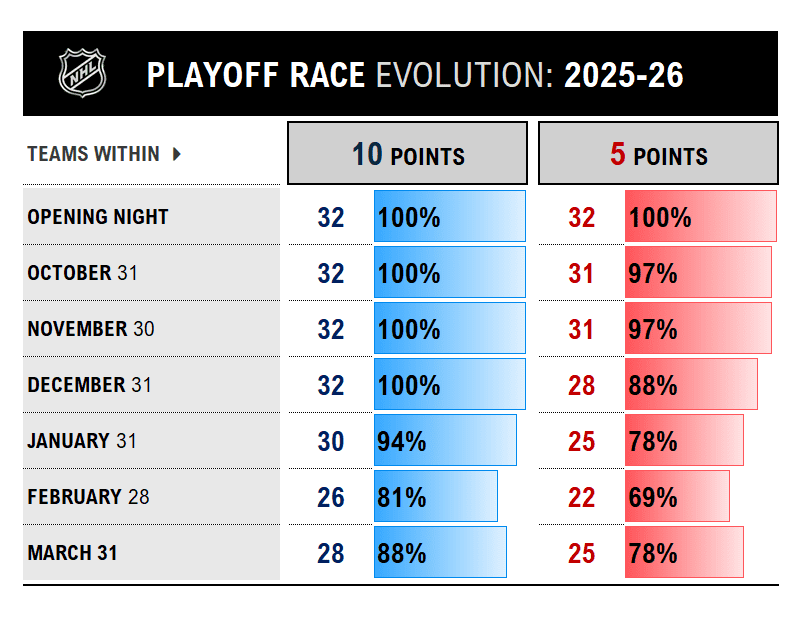
The graphic above shows how incredibly long that teams hung around the playoff mix. On New Years’ Eve, all 32 teams were within 10 points of the playoffs. When the calendar flipped to 2026, only the Winnipeg Jets were seven or more points back. Your beer league team might have been tied with the New York Rangers at one point in February. As late as April 3 — when teams had played an average of 76 games — there were still 25 franchises within five points of the postseason.
There’s little reason to think this Season of Parity is a permanent fixture. The past ebbs and flows of playoff races and franchise cycles tells us it’s more perfect storm than repeatable trend. But the results made for an exciting stretch drive where a lot of mediocre franchises sold tickets and felt competitive. In other words, it’s been good for business.
#2. Even more loser points blurred the standings this season.
Why was the playoff race so tight this year, you might be asking? After all, the NHL has issued points for losing after regulation since 1999, introduced shootouts in 2005, and featured 3-on-3 overtime since 2015. The salary cap era has never experienced this many points clogging the system, though. The visual below normalizes the last decade for schedule length and team count to fairly compare point totals.
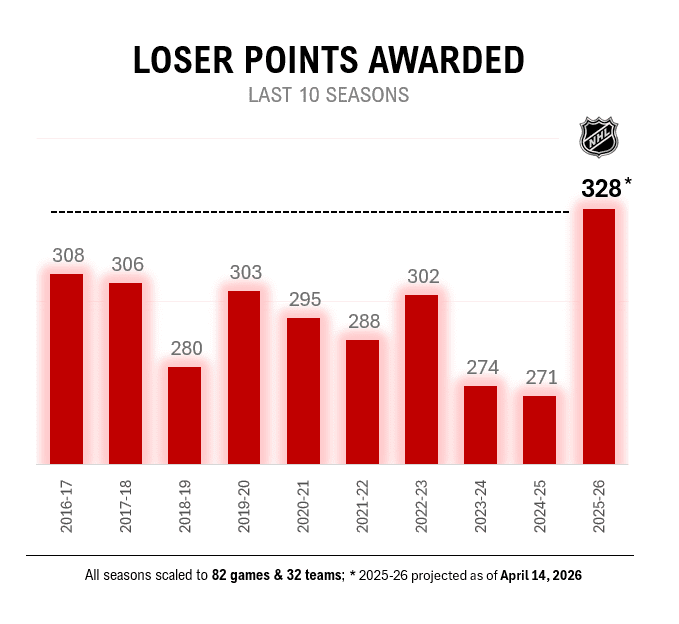
Teams averaged eight or nine loser points each in 2024-25. This season, the NHL is on pace to dish 57 more loser points — about another two per team — to further confuse the standings. With two days of action left, the current pace is at 328 total points subject to the randomness of overtime and shootout action.
And make no mistake, these points are quite random. The first-place Colorado Avalanche? 7-11 beyond regulation. The last-place Vancouver Canucks? 10-8. The star-studded Edmonton Oilers? 9-11. The Vegas Golden Knights‘ 9-17 post-regulation record completely changed the perception of their season.
By devaluing regulation wins, the NHL relies on the quirks of overtime and shootouts to camouflage results. It’s long been manufacturing competitive balance through gimmicky formats, rewarding teams for hanging around games versus trying to win them.
#3. A lot of teams saw extreme swings from last season.
The last few NHL seasons featured clear divides around rebuilding teams and win-now franchises. It led to a more predictable playoff field. 2025-26, however, has been pure fun and chaos. Overall, while only six of 16 playoff teams flipped, there were many big point swings across the league.
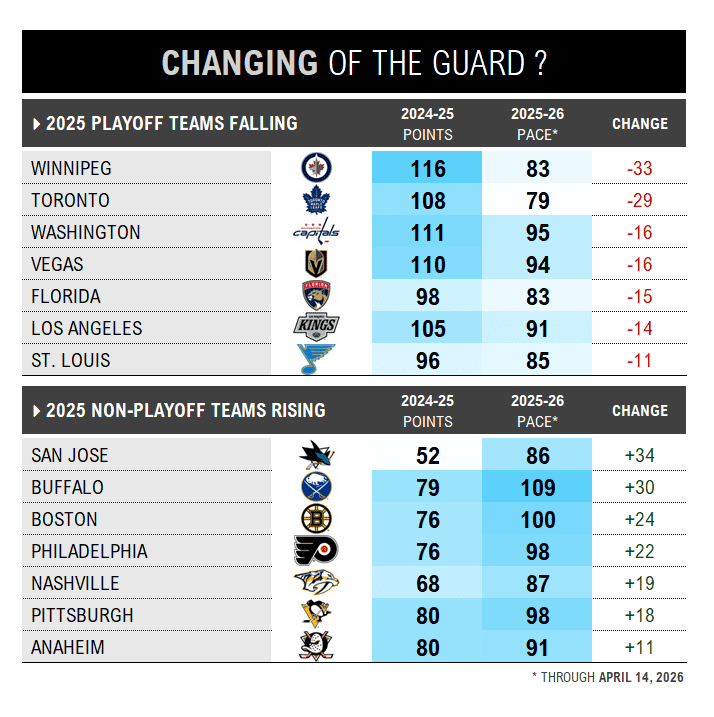
Of last season’s nine 100-point teams, only three repeated the feat: Colorado, the Dallas Stars and the Tampa Bay Lightning. Four 100-point teams took big steps backward, namely Winnipeg, Los Angeles, the Toronto Maple Leafs, and Washington Capitals. The two-time defending champion Florida Panthers looked old and broken overnight, pacing toward a 15-point dip in a lost season.
Seven of last season’s playoff teams are on pace to drop at least 11 points in the standings, led by huge plummets from the Jets (-33 points) and Maple Leafs (-29). Six teams that missed the 2025 playoffs, meanwhile, are pacing to gain at least 18 points — including stunning glow-ups for the San Jose Sharks (+34) and Buffalo Sabres (+30).
Is this the start of a changing of the NHL’s guard where rebuilds and retools come to life?
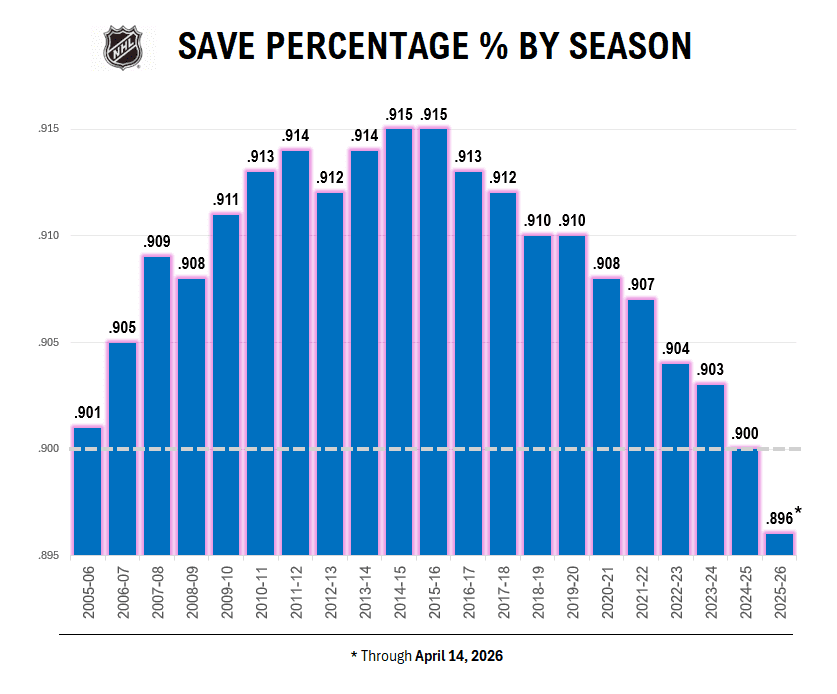
#4. Save percentage officially cratered this season.
NHL goaltenders haven’t gotten worse. They’re much bigger, faster, and better coached than ever. The league-wide disintegration of save percentage, meanwhile, has reached mid-1990s levels. Overall, save percentage has dropped 19 points in the last decade and seven points in the last two seasons alone.
There are many reasons behind the trend, and remarkably, they have nothing to do with goaltending:
- League tracking has changed dramatically: The NHL has used technology to refine its shot count over the years, more recently leveraging new tracking data and video angles. By closely auditing shots, several saves come off the clock most nights that were credited to goalies just a few years ago.
- 3-on-3 overtime: Most of the chances in overtime are odd man rushes, breakaways, and shots from the slot. The introduction of 3-on-3 overtime altered the difficulty of shots significantly. It’s not a coincidence that save percentage’s descent began immediately after the format was introduced in 2015-16.
- Analytics has changed how players shoot: One of the analytics movement’s best outputs is coach and player education on shot selection. Not long ago, ‘pucks on net’ was the mantra. Now, shot selection drives offenses. Shots today have pre-shot passing, are taken from close proximity, strategically drive rebounds, target goalie weaknesses, are off the rush with speed, or are taken with traffic. There are very few freebies. A better understanding of what shot types are successful has led to better shots.
The shot evolution means a greater need to pivot how we evaluate goaltenders. Comparing a goalie or team’s save percentage from 2023-24 is already pointless, the league average being unrecognizable. Andrei Vasilevskiy is tied for third in the NHL in save percentage (.912). In 2014-15, that same save percentage would have been 30th. It accelerates the need to focus on GSAx (Goals Saved Above Expected) as the premier goalie stat, which eliminates the noise of a rapidly changing goaltending environment.
#5. Overtime isn’t deciding games like it used to.
While better shot selection has helped create higher-quality scoring chances in regulation, the same can’t be said for overtime. All that time and space leads to a vicious cycle of snooze-worthy regroups. After the players had seemingly mastered OT last season — a record 71.6% of overtimes decided games — the trend buckled in 2025-26.
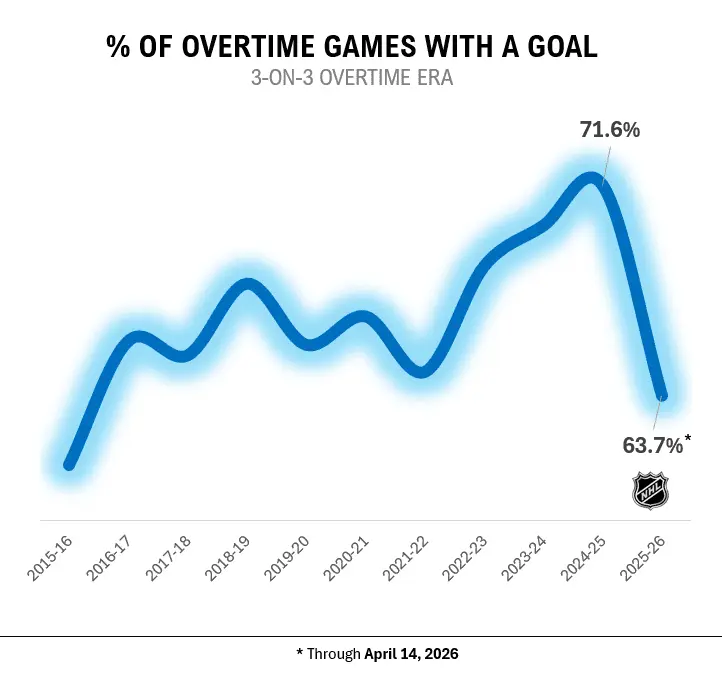
That’s an 8% dip in overtime conversion — the lowest mark since the 3v3 format’s introduction. The implications are mostly all bad from an entertainment perspective: fewer shot attempts; more games going goalless for the full five minutes of overtime; fewer big, memorable goals; and more shootouts.
After all but eliminating shootouts — there were just 77 last season — the league is on pace for 119. That’s the most in the 11 seasons of 3-on-3 overtime. Is an over-and-back rule necessary? Will it need to be a penalty to have any teeth? Would scrapping the shootout altogether force teams to chase the second point in overtime to avoid a tie? The trend is worth meaningful discussion by the Competition Committee.
Data from NHL.com; Hockey Reference
Recently by Paul Pidutti
- Weighted scoring race 2025-26: Who are the point merchants and unsung scorers?
- Where does Macklin Celebrini’s sophomore season rank all-time?
- Long live the King: How good was Anze Kopitar anyway?
- 2026 career projections: Will McDavid, Crosby or MacKinnon reach 2,000 points?
- Setting up the major stat races on the NHL’s stretch drive
- Are first-round draft picks overrated trade targets?
_____
PRESENTED BY STAKE
